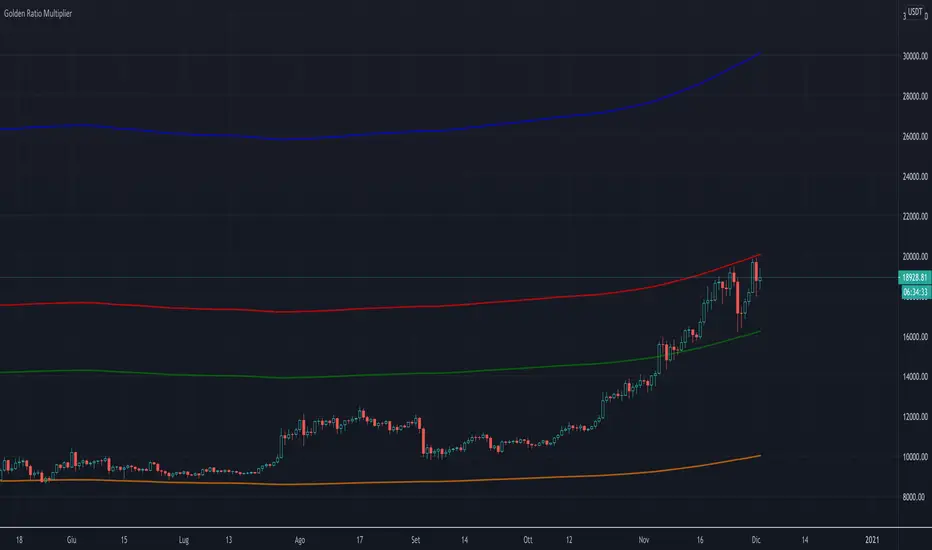
Golden Ratio Multiplier (x1.6; x2; x3)The script displays three multipliers (x1.618; x2; x3) of the Golden Ratio (starting with MA at 350 days) to identify the following levels of support:
the multiplier x1.618 is an accumulation high (green line)
the multiplier x2 is a support that identify a low bull high (red line)
the multiplier x3 is a support that identify an upper bull high (blu line)
Note: the orange line is the SMA at 350 days.
Buscar en scripts para "the script"
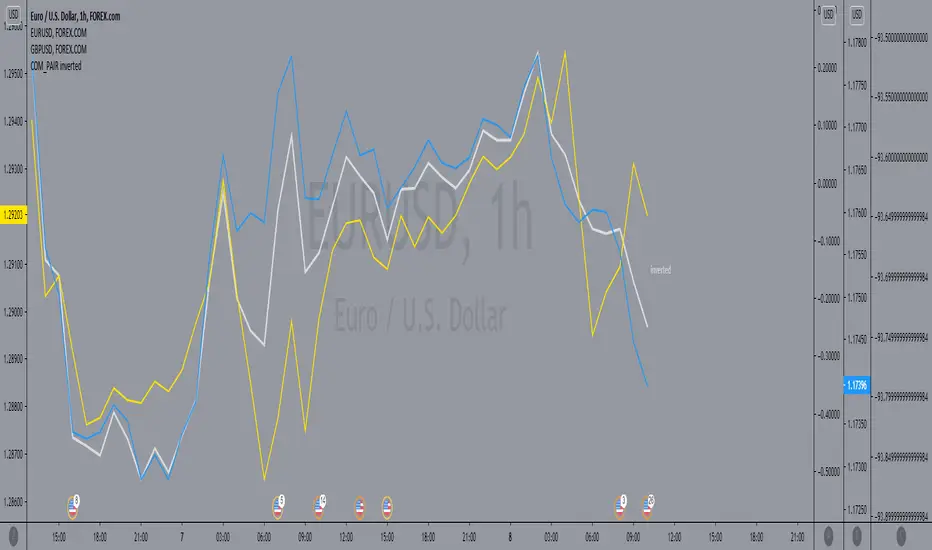
COM_PAIR invertedthe script make it easy on the eyes to compare the inverted symbols lines in comparison with the others, for example by utilizing TVC:DXY / FOREXCOM:USDCAD / FOREXCOM:USDJPY, you cab easily compare with them to EURUSD and GBPUSD.
Momentum Adjusted EMA TrendThe script draws a moving average which responds to trend changes extraordinary fast!
It's calculated using Momentum, Acceleration and Probability (Psychological Effect) by interfering the Golden Ratio!
I got the idea thanks to Tradingview user DGT (dgtrd) and his/her excellent descriptions.
The indicator is simplified for users and the default settings work great, so use it as you like specially as a trend indicator.

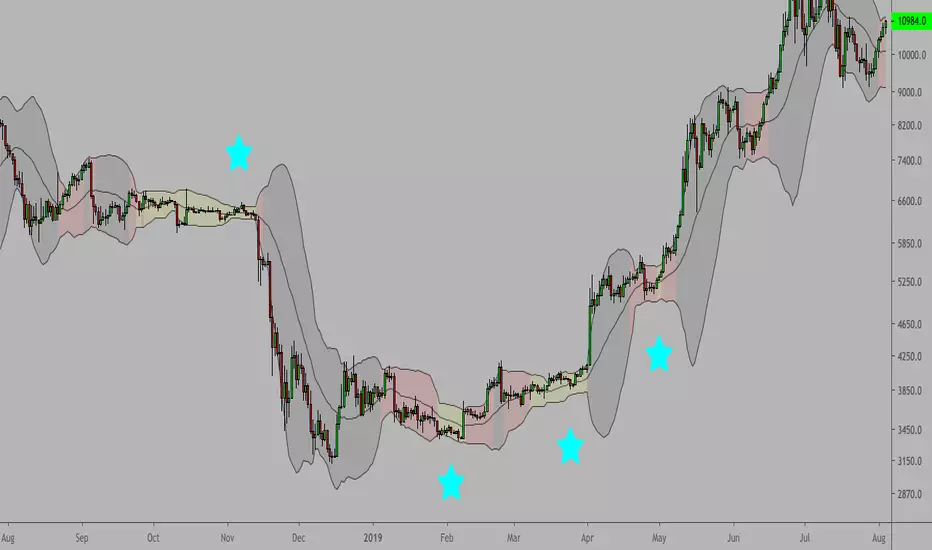
Trend Indicator with BUY SELL signalsThe Script can be used to identify the main trend and take BUY/SELL decisions in the lower time frames.
The tool can be applied as follows
1) Apply the tool your favorite chart
2) Select the main trend.
3) Go to lower time frames to check the BUY/SELL signals. Example: If the selected main trend is 4 hrs then go to time frames below 4 hrs to find the entry and exit positions.
Feel free to reach out to me if you need any further information

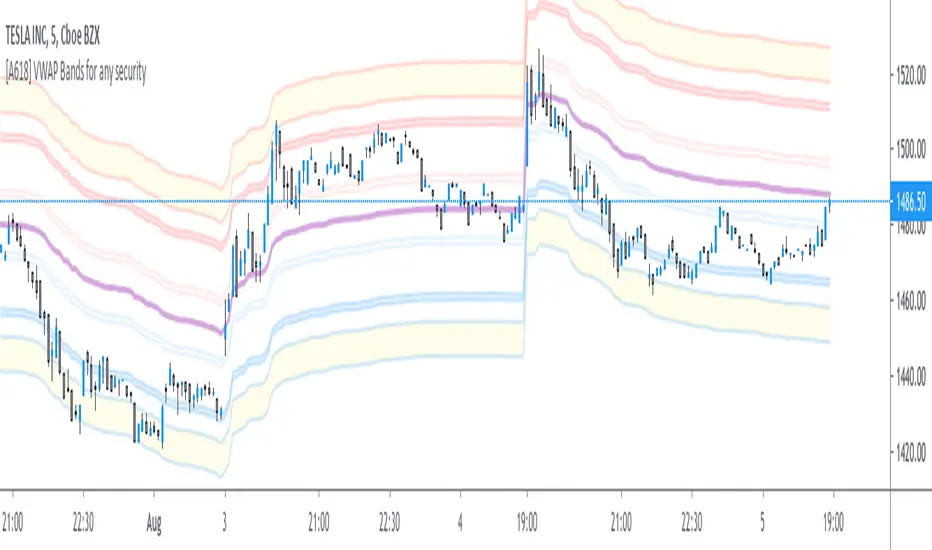
[A618] VWAP bands for any SecurityThe Script plots Standard Deviation Bands around The VWAP line,
This will help you out with detecting market overbought and oversold Conditions on the Fly
Use this in conjunction with an oscillator
- stoch, macd, etc...
- if you find a positive crossover with oscillator on a VWAP level its time to go long, targeting the next vwap level and vice-versa
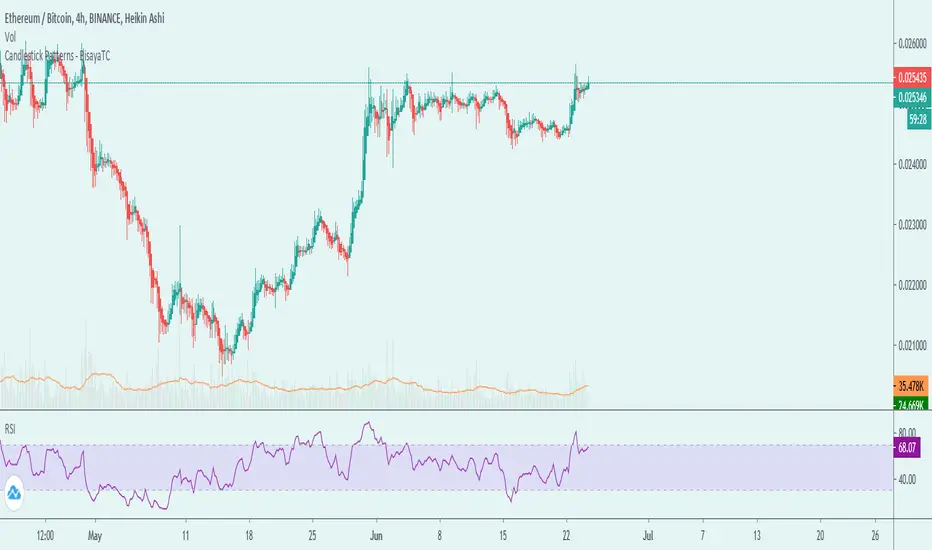
Candlestick Patterns - BisayaTCThe script displays a label when a candle stick pattern is detected based on Trends. This is related to the latest Candlestick patterns released in TradingView. I've created this to have all candlestick patterns in one indicator.
Candlestick Patterns can be one of confirmation of a trend you're following or a reversal.
DISCLAIMER: For educational purposes only. Nothing in this content should be interpreted as financial advice or a recommendation to buy or sell any sort of security or investment including all types of crypto. DYOR
Rolling midpointsThe script made for research purposes which plots these statistics of a given window: Mid-range (max + min)/2, Lower midpoint (mid-range + min)/2, and Higher midpoint (mid-range + max)/2.
This could be interesting when checking periods with sample size <= 0, or checking distros with srs kurtosis values.
Mean & median are also there.

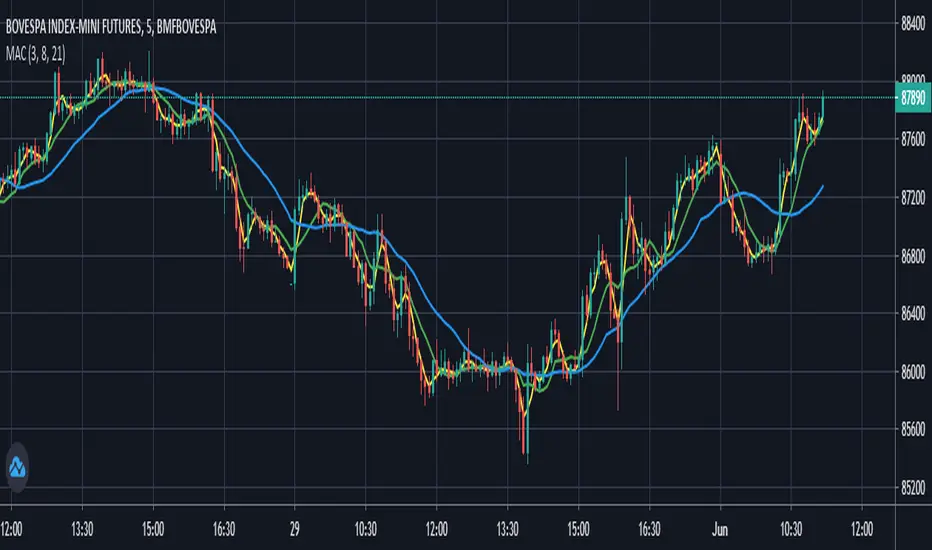
Moving Averages Convergence (Agulhada do Didi)The script is based on a strategy developed by Odir “Didi” Aguiar called “Agulhada do Didi”.
It consists in the use of 3 moving averages:
SMA 3
SMA 8
SMA 21
Strategy:
When the averages come together, preferably they pass through a candle, there is a signal. The crossing of the short average (3) with the long average (21) provides us with a confirma-tion of the entry.
Buy:
The average of 3 periods comes out on top, 8 goes in the middle and 21 goes down.
Sell:
Average of 21 periods comes out on top, 8 in the middle and 3 down.
Bull Club BiasThe script intends to eliminate noise from the chart. It uses a combination of multiple indicators into 1.
For long bias:
Close is greater than the ADX
15 Period EMA on close is greater than SMA on high
13 period RSI is greater than 25 periods RSI
MACD is greater than 0
For short bias:
Close is lower than the ADX
15 Period EMA on close is lower than SMA on high
13 period RSI is lower than 25 periods RSI
MACD is lower than 0
For every other combination, it is a range-bound bias. NSE:BANKNIFTY
A green background indicates long bias
A Red background indicates short bias
An Orange background indicates range-bound bias

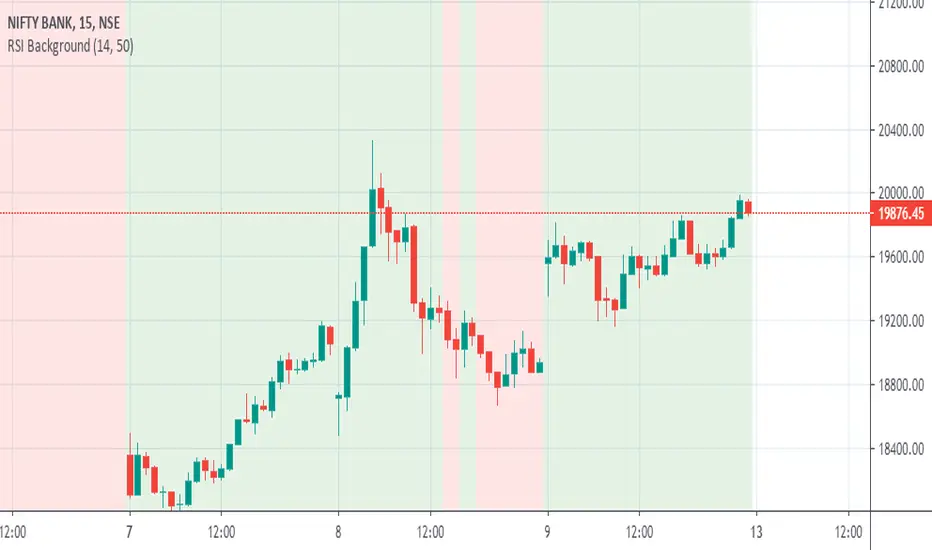
RSI 50 BackgroundThe script changes the background depending on the RSI 14 values. If RSI 14 values is above 50 the background is green and if RSI value is below 50, the background will be red.
5MAThe script contains five moving averages: MA50 , MA100 , MA200 , EMA30 , SMMA10 .
You can adapt it for yourself and use it on any markets.

Bulls vs BearsThe script measures relative strenth of bull bars vs bear bars that complete the next rules:
1) rising price with rising volume calculates as bullish only if the next candle is higher
2) falling price with falling volume calculates as bullish only if the next candle is higher
3) rising price with falling volume calculates as bearish only if the next candle is lower
4) falling price with rising volume calculates as bearish only if the next candle is lower
examples
ethusdt
shitperp
bsvusdt
btcusdt

Cumulative VolumeThe script shows how to accumulate volume values during a defined session/period.
The input is the period to use for accumulation. "D" is the default value, useful to view data for each session.

IntraDay Pivot Lines, 30min IBThe script draws critical lines for IntraDay traders:
1) High/Low of the last Month - in Red/Green thick line
2) High/Low of the last Week - in Red/Green
3) High/Low of the first 30minute of the current trading day - in Yellow
4) High/Low of the first 5min of the trading day - in Grey
Two Lines Diferent M (derivate)The script is only for information about two lines of diferent derivates, one with 10 candles and the another with 30 candles, the diferent slope of those lines tangents shows an indication of a tendencial if the value of the instrument is bearish or bullish.
Its aplicable to all instruments in high volatility times.
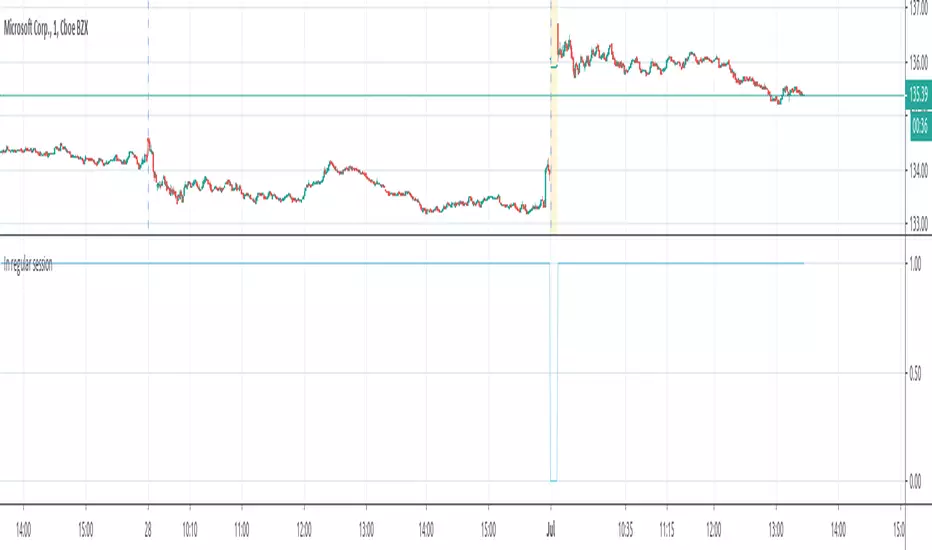
Premarket High/LowThe script draws the high and low of the premarket session and based on these levels the ATR is added and also displayed on the chart as lines.
You can change:
- The Session Timeframe
- The ATR Multiple
- If the Aftermarket Session should be included

Support and Resistance plotterThe script uses high/low/higher high/lower low for Support and Resistance identification but takes into account only pivots with wick making low/high opposite to candle body. Such candles point to hard market swings into during candle timeframe.
Price usually come bake to such levels and make double top/bottom, divergences on different osc or starts a new trend if this level is broken.
If Support lvl and Resistance lvl meets the movement of price in the direction from this combined lvl is much accelerated.
examples

Rolling Moving Average, SMA/EMA, for IPO stocksThe script replicates the standard EMA/SMA used by tradingview, but also adds an estimate for the first X periods, where X is the length of the moving average. This allows for an estimate of support resistance in IPO stocks, when fewer date is available

Candle Patterns StrategyThe script allows you to test popular candlestick patterns on various instruments and timeframes. In addition, you can configure risk management (if the value is zero, it means the function is disabled), and you can also specify the time of the trading session (for example, so that the positions are not transferred to the next day).
The author is grateful to JayRogers and Phi35, their code examples helped a lot in writing the strategy.

Max of VWAP of last three daysThe script searches for max values of last three days and then calculates average of those values

BolingerBands_Contraction_Bitcoin_dailyThe script visualises the contraction or tightness of the Bollinger Bands (example Bitcoin on the daily timeframe). The contraction values have to be adjusted for each asset/coin/stock and timeframe. See what works for you.